
What the Music Genome Project Can Teach Craft Breweries
By Brian Winckel · Founder, Brewlytics.ai
Short Answer
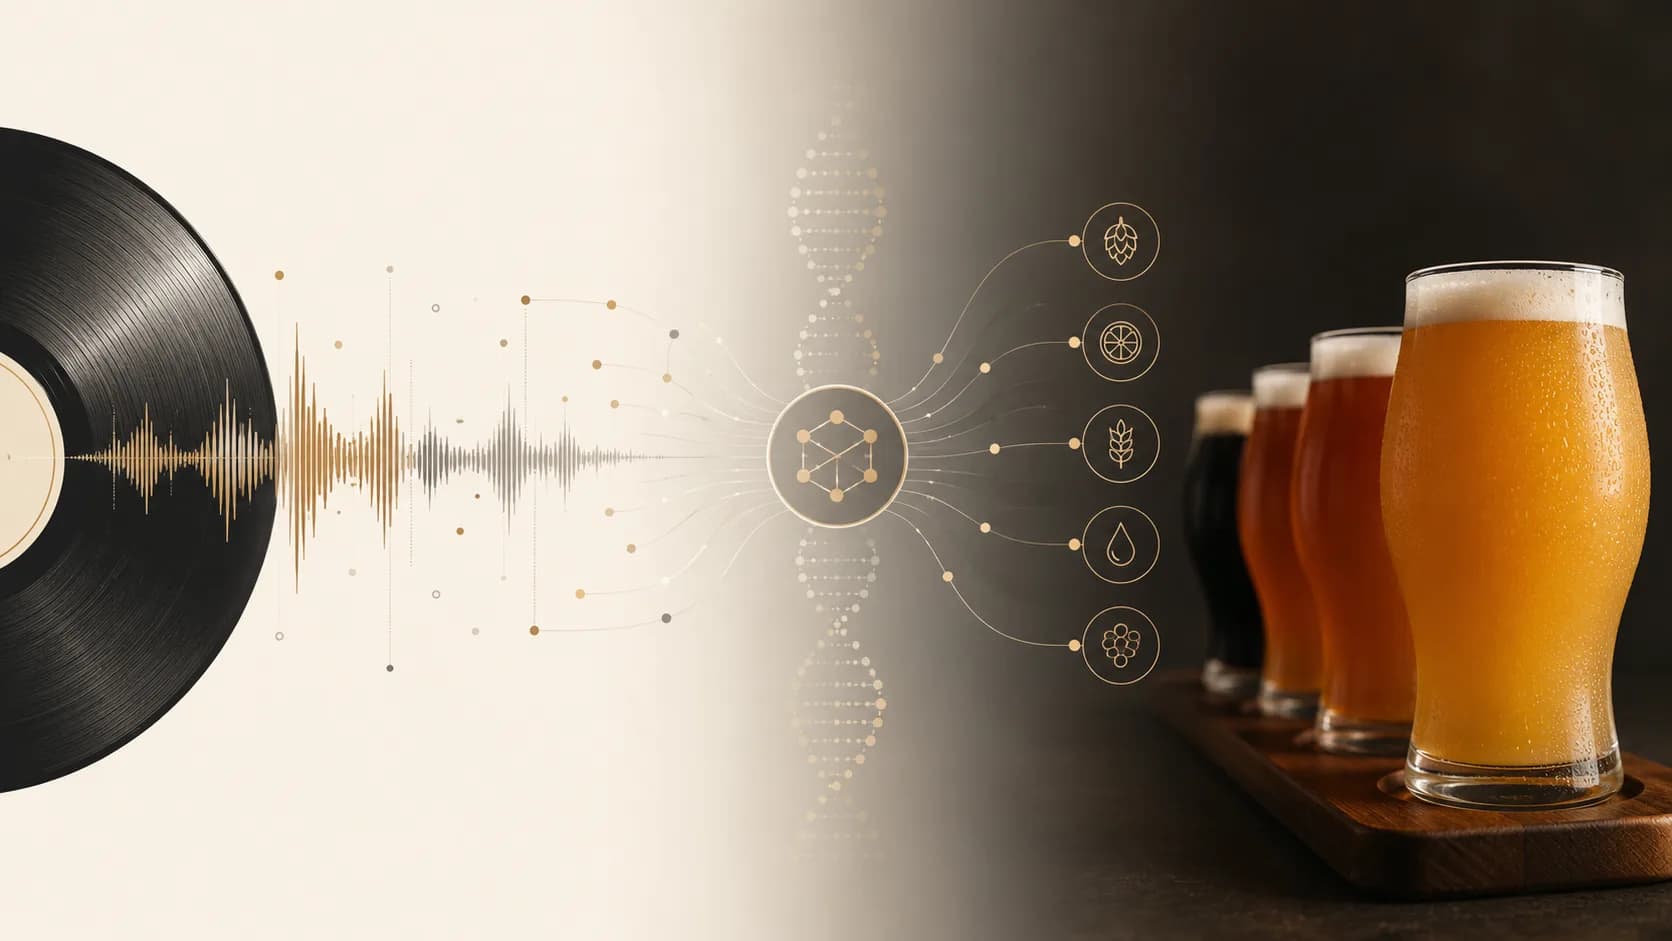
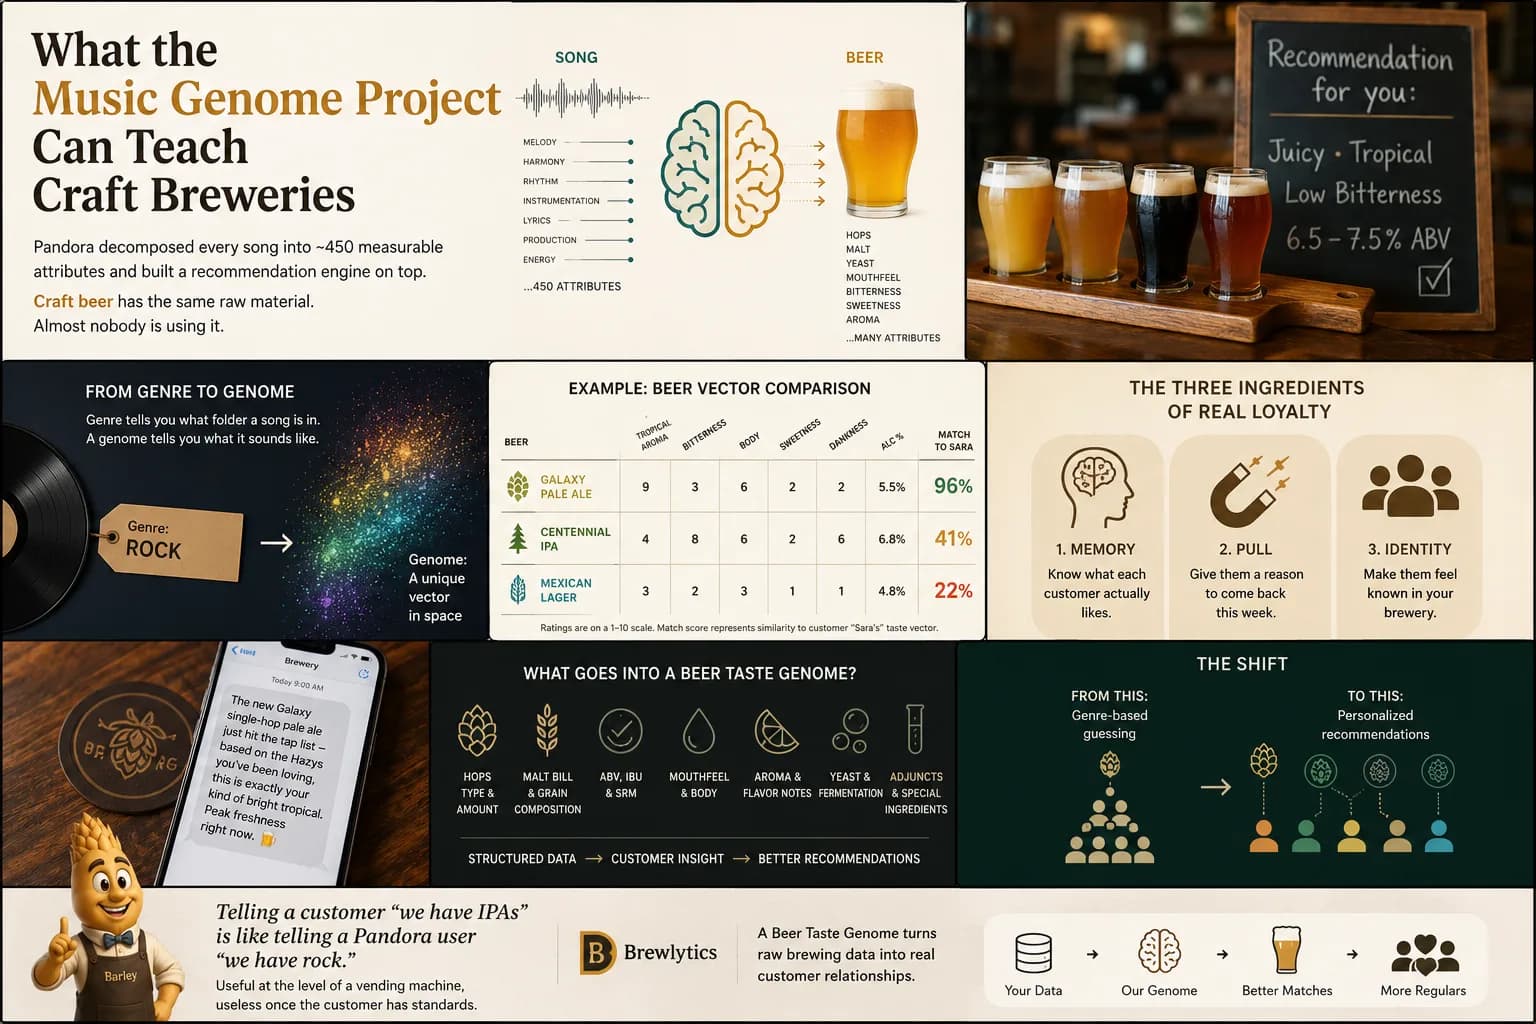
The Music Genome Project decomposed every song into roughly 450 measurable attributes and matched listeners along those vectors instead of by genre. Craft beer has the same raw material — style, hops, malt, ABV, mouthfeel, sensory notes — but most breweries leave it unstructured and recommend by genre tags or nothing at all. A Beer Taste Genome turns that raw material into something a recommendation engine can use, and it's the difference between 'you like IPAs' and 'you like dank Citra IPAs at 6.5–7.5% ABV with low residual sweetness.'
Barley's Take
Telling a customer 'we have IPAs' is like telling a Pandora user 'we have rock.' Useful at the level of a vending machine, useless once the customer has standards.
Why This Matters for Breweries
In the early 2000s, Pandora bet that the right way to recommend music was not by genre, not by what was popular, and not by what your friends were listening to — but by the song itself, decomposed into measurable attributes. The Music Genome Project paid trained musicologists to hand-classify roughly 450 musical traits per song. Beat strength. Vocal harmonies. Tonal clarity. Use of acoustic instrumentation. Tens of thousands of songs, one vector each.
That structured database is what let Pandora recommend an artist you'd never heard of and have it land. Not because the artist was famous, not because your friends had endorsed them, but because the song's vector sat close to the songs you'd already thumbed up. It was the difference between "people who liked Radiohead also liked Coldplay" and "this song shares 14 specific structural attributes with the songs you said you loved."
Craft beer is in roughly the same place music was in 1999. The recommendation surface most breweries offer their customers is the equivalent of a record store divided into "rock," "country," "jazz." A few breweries have a "we recommend" bar staff suggestion. Most don't have anything past the tap list. And the customer, knowing nothing about what's behind each tap handle, picks by either name, color, or what the person before them ordered.
There is a much better version of this experience available to breweries right now. The raw material exists; it's just unstructured.
The Beer Genome Already Exists — It's Just Sitting in a Spreadsheet
Every brewery in America already has, somewhere in a Google Sheet or a brewer's notebook, the data that would make up a Beer Taste Genome. For each beer:
- Style and sub-style (West Coast IPA, Hazy IPA, NEIPA, Cold IPA)
- ABV and IBU
- Hop bill (Citra, Mosaic, Galaxy, Nelson, Strata)
- Malt bill (2-row, Munich, oats, wheat)
- Yeast strain (London Ale III, Conan, Kveik)
- Water profile
- Mouthfeel notes (creamy, dry, oily, watery)
- Perceived bitterness, sweetness, dankness, juiciness, sourness
- Color (SRM)
- Carbonation level
- Adjuncts (lactose, fruit, coffee, spice)
Add the customer's actual orders + ratings on top of that, and you have a vector for every customer too. Then matching becomes arithmetic: which un-tried beers in the catalog are closest in vector space to the beers this customer has already loved?
That's not a research project. That's a structured way of writing down what brewers already know.
How a Beer Taste Genome Actually Works
There are three layers, none of them exotic.
1. The beer vector
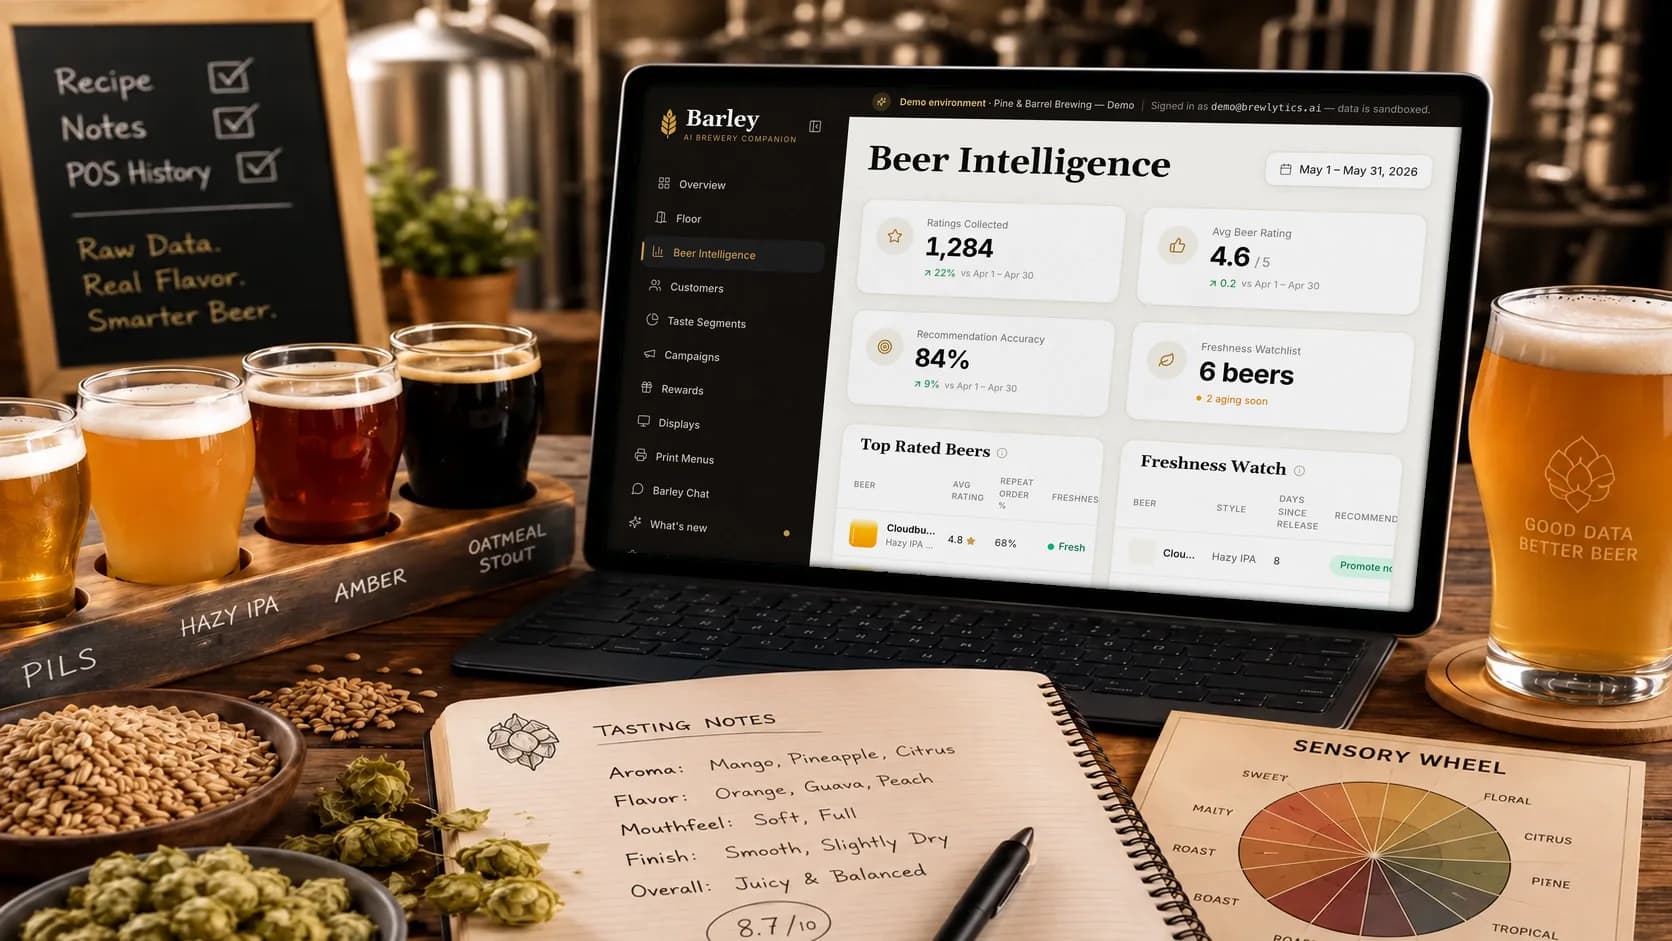
Every beer is a structured object with somewhere between 20 and 60 measurable attributes. Some come from the recipe (hops, malt, yeast, ABV). Some come from the brewer's tasting notes (perceived bitterness 1–10, juiciness 1–10). Some come from the brewing data (water profile, fermentation temperature). The exact number doesn't matter; the discipline of writing them down does.
2. The customer vector
Built from what a customer actually orders, reorders, and rates inside the app. A customer who claimed three Hazy IPAs in the past 60 days and gave them an average 4.5/5 is producing signal about juicy, tropical, low-bitterness preferences. Add a single rejected pour of a stout and the vector sharpens. New customers get a short, optional onboarding quiz to seed the model; from there every vector grows as the customer keeps engaging — claiming orders, rating beers, asking Barley what to drink next.
3. The recommendation
A function that takes a customer vector, takes the set of currently-pouring (or in-stock) beers, computes the distance from the customer to each beer, and returns the closest matches that the customer hasn't tried yet. Bonus signal if those beers are in their peak freshness window — that's a separate axis, but it's where the genome connects to the taproom moment.
None of this is AI sleight-of-hand. The math is straight nearest-neighbor on a vector space. The hard part — and the part that has nothing to do with code — is producing the structured beer data in the first place.
Example Brewery Scenario
Pretend you run a 7-barrel taproom with 10 beers on tap and four packaged for off-premise. A regular named Sara has ordered:
- Hazy IPA × 3 (rated 5, 5, 4)
- West Coast Pale Ale × 1 (rated 4)
- Saison × 1 (rated 3)
- Stout × 0
- Lager × 0
A genre-level recommendation engine sees this as "Sara likes IPAs and pales." Its next-week message to Sara would be: "We have new IPAs on tap, come in!"
A Beer Taste Genome recommendation engine sees Sara's vector and reads it as: high preference for tropical/citrus hops (Citra, Mosaic), low preference for resinous/piney (Simcoe, Chinook), low preference for bitter, mid preference for body, neutral on color, low preference for funk. It compares that to your current tap list and finds:
- Your new Galaxy single-hop pale ale (Galaxy is tropical, low bitterness, fits her body preference) — 96% match
- Your old-stock IPA brewed with Centennial (resinous, higher IBU) — 41% match
- Your Mexican Lager (low body, neutral hop) — 22% match
Sara's Tuesday morning message reads: "New Galaxy single-hop pale ale just hit the tap — based on the Hazys you've been loving, this is exactly the kind of bright tropical you've been ordering. Peak freshness right now."
She comes in Wednesday. The Centennial IPA — which sat at the same position on the punch-card customer list as her new favorite — never got pitched to her. Because the punch card didn't know.
The Other Half: Who Else Loves It
The genome so far is content-based — it matches a customer to beers that resemble the beers they already love. There's a second engine worth running alongside it, the one behind iTunes Genius and "customers who bought this also bought": collaborative filtering. Instead of asking "what is this beer like?", it asks "who else has a palate like this customer's, and what did they love that this person hasn't tried yet?"
The two approaches cover each other's blind spots. Content-based matching is great on day one — it can recommend a brand-new beer nobody has rated yet, because it reads the beer's attributes. But it can miss the happy accident: the smoked lager a customer would adore even though its vector sits nowhere near their usual order. Collaborative filtering catches exactly those — it surfaces beers loved by drinkers whose taste neighbors this customer, even across style lines.
The best recommendation runs both: the genome for what a beer is, collaborative filtering for who else loves it. One keeps recommendations precise; the other keeps them from getting boring.
What the Genome Doesn't Replace
A taste genome is a tool, not a worldview. A few things it deliberately doesn't do:
- It doesn't replace the bartender's read of the room. A customer's vector tells you what they've loved; a good bartender notices when they walk in with a friend who's clearly new to craft and gently steers them to the safer middle.
- It doesn't kill discovery. A well-designed recommendation engine has a "stretch" channel — beers two or three vector-units outside the customer's comfort zone, surfaced occasionally to expand the palate. Pandora did this; Brewlytics does this.
- It doesn't make the beer. The genome is downstream of the brew. A vector for a poorly-brewed beer is just a precise way to find the wrong customer.
How Brewlytics Helps
Brewlytics is the working implementation of a Beer Taste Genome for craft breweries:
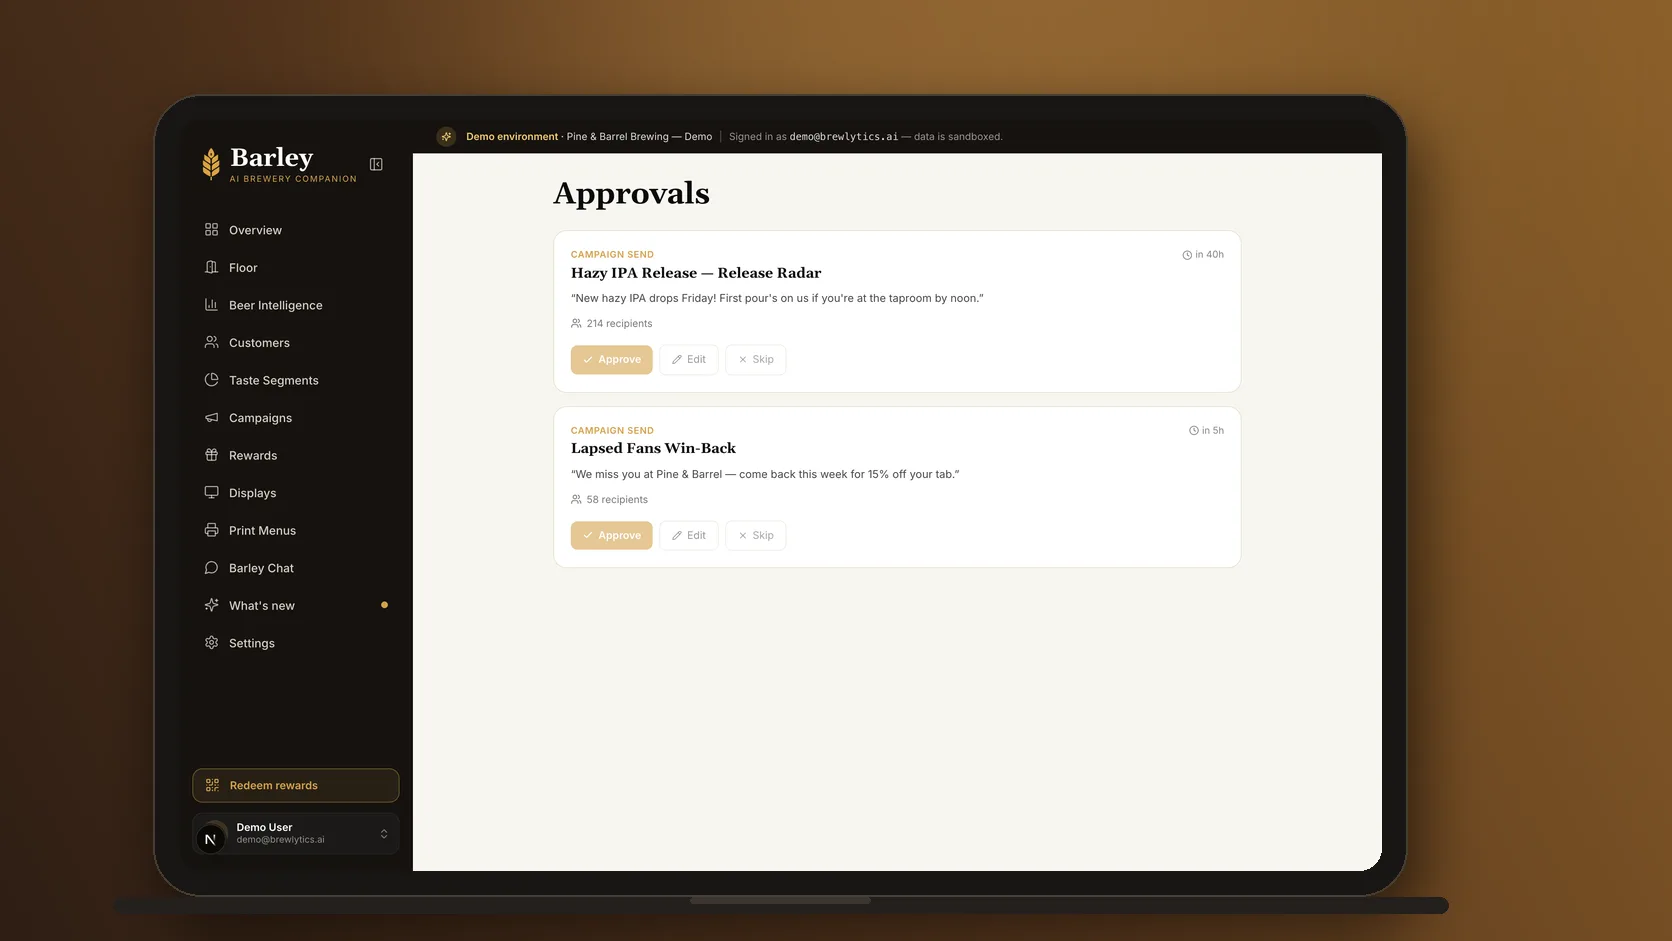
- Beer Intelligence sits on top of your Square catalog (Toast and Arryved are on the roadmap). Every beer in your POS gets enriched with the structured attributes that make up its vector — style, hop bill, ABV, sensory notes, freshness window.
- Customer Taste Profiles accrue as customers engage — rating beers, claiming orders, chatting with Barley, answering the onboarding quiz. No survey, no tablet at the bar. Every bit of engagement sharpens the customer's vector in seconds.
- Barley, our AI bartender, is the customer-facing surface for the genome. Customers ask "what should I order?" and Barley uses their vector against your current tap list to suggest the best fit — not the most popular, not the highest margin, the best fit.
- Fresh Beer Alerts combine the genome match with peak-freshness windows. A customer hears about your new Galaxy pale not because they're on a list, but because their vector matches the beer's vector and the beer is at peak.
The model gets sharper with every order, every rating, every fresh batch you tap. Your existing POS data is the seed.
Practical Checklist
If you want to start writing down your brewery's genome today, this is enough to begin:
- Make a sheet with one row per beer and one column per attribute. ABV, IBU, hop bill, malt bill, yeast, perceived juiciness (1–10), perceived bitterness (1–10), perceived dankness (1–10), perceived sweetness (1–10), perceived sourness (1–10).
- Fill it in for the beers you're pouring this month. Don't try to backfill four years of recipes; start with what's on tap.
- Have one person (head brewer or a trained palate) score the sensory axes. Consistency matters more than perfection — better to have one person scoring 5/10 in a consistent way than three people disagreeing.
- Map your top 50 customers' orders against the sheet. Even by hand, the patterns surface fast.
- Pick one customer segment and one upcoming release. Send a personalized message. This is the smallest possible test of the genome idea, and you can do it with a spreadsheet before you ever buy software.
When the spreadsheet stops fitting on one screen, that's when a recommendation engine starts paying for itself.
Ready to see your brewery's genome on a real dashboard?
Most breweries already have a menu worth more than they realize. We can read your Square catalog today, score your current pour list along the genome axes, and show you how customer vectors fill in as drinkers engage with Barley.
→ Book a demo and bring your POS account. → See how Brewlytics works before you talk to us.
Frequently asked questions
Related Brewlytics Feature
Customer Taste Profiles
Taste profiles that build as customers engage — quiz, ratings, and chat.
See how it works →Keep reading
The Future of Brewery Customer Engagement Is Personalized
Craft beer marketing is moving from blasts and segments to one guest at a time. What identity-aware personalization looks like, and where it turns creepy.
How Sensory Feedback Can Improve Brewery Recommendations
Five stars tells you a guest liked the beer, not why. Here's how to collect sensory feedback one tap at a time and recommend the next pour accurately.
Why Brewery Email Blasts Don't Work Like They Used To
Email open rates collapsed, Instagram reach is a rounding error, and the Tuesday newsletter doesn't move pints. Here's what's replacing broadcast blasts.
Want to see this working in your brewery?
Go Pro to see your customers and act on the data — taste profiles, segmented iMessage, SMS + email campaigns, the AI bartender, and the full dashboard. Or book a walkthrough with the brewer who built it. Not ready? Start free, no card.
Just here for the beer? Get the free Barley app