
How Brewpubs, Taprooms, and Production Breweries Need Different Data
By Brian Winckel · Founder, Brewlytics.ai
Short Answer
They make money in different ways, so they need different numbers. Brewpubs should watch food attach rate and beer's share of the check. Taproom-only breweries should watch second-visit rate, visit cadence and at-risk regulars. Production breweries should treat the taproom as a test market and watch which pilot beers the same customers reorder before scaling them.
Barley's Take
A brewpub, a taproom and a packaging brewery walk into a dashboard. If all three see the same chart, two of them are reading somebody else's mail.
Why This Matters for Breweries
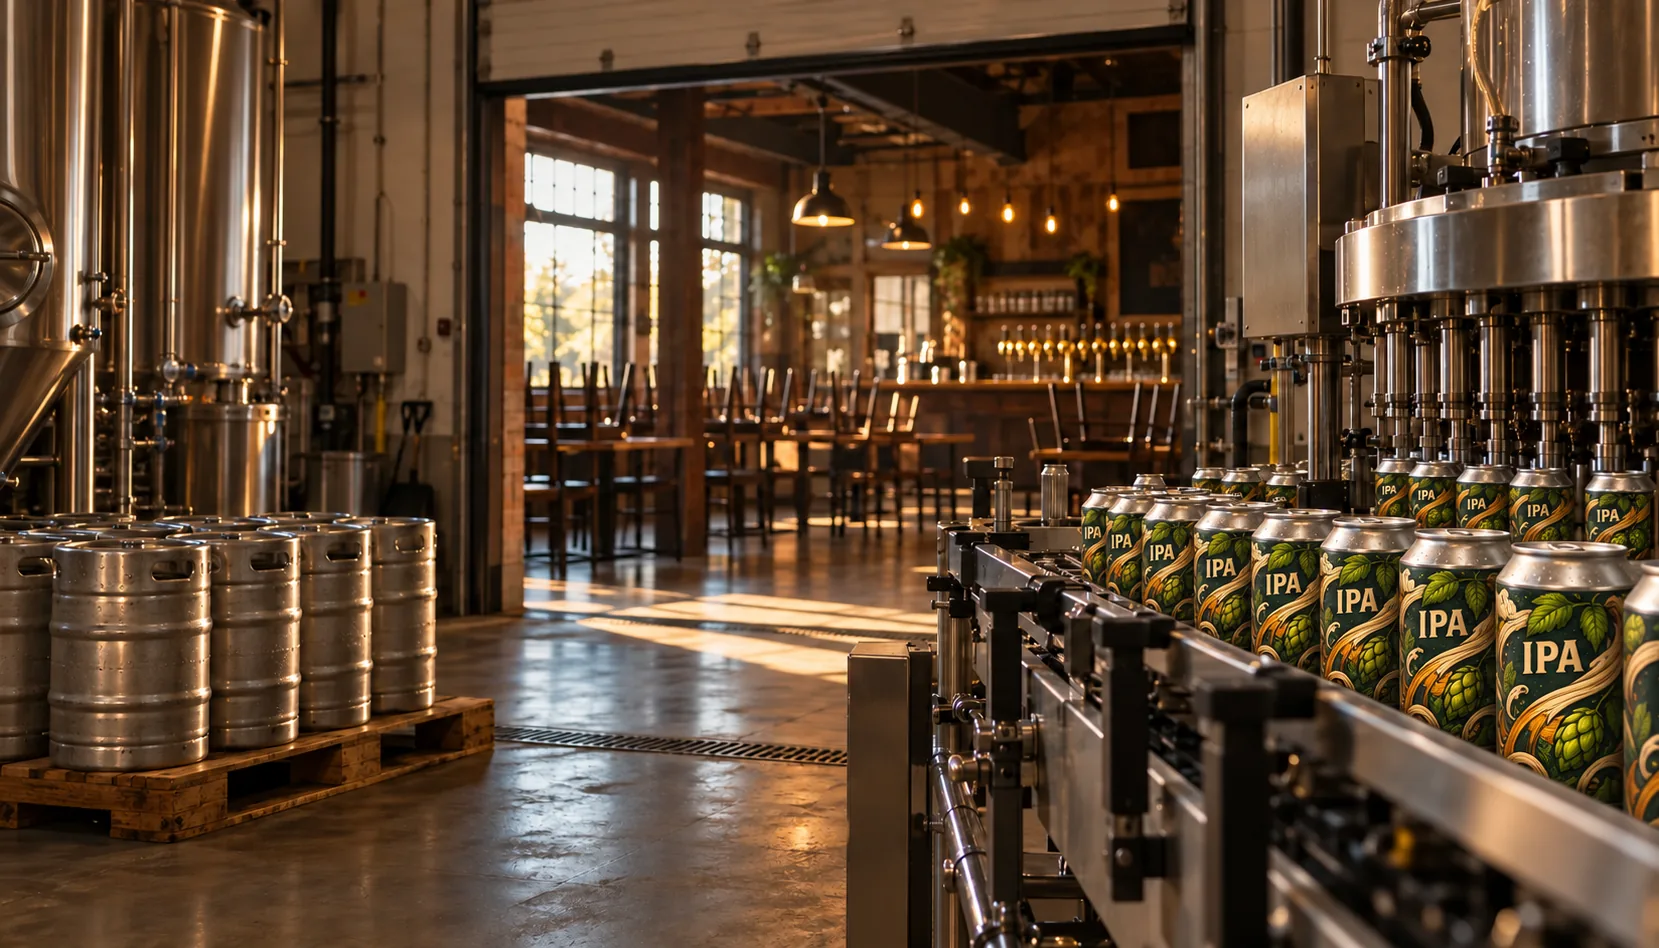
Picture three breweries with the same Square terminal on the bar. One runs a full kitchen and sells more smashburgers than pints on a Tuesday. One is a 5-barrel taproom where the bar is the whole business. One ships most of its Pilsner and Hazy IPA out the back door in kegs and cases, and the taproom is a room off the warehouse.
All three can pull the same weekly sales report, and for two of them it answers the wrong question.
A business model, for this article, means where the money actually comes from: the kitchen, the bar, or distribution. Each one has a different "is this working?" question, and the metrics that answer one model's question can mislead another. Weekly taproom revenue is the headline number for a taproom-only brewery. For a production brewery that sells most of its volume through a distributor, the same number says little about whether next quarter's can release will work.
Most breweries already have more numbers than they read, so the fix is rarely more data. It's pinning the right three to the top.
How It Works
Each model asks a different core question. Here is what to watch, what to ignore, and where the data lives.
Brewpubs: the check is beer plus food
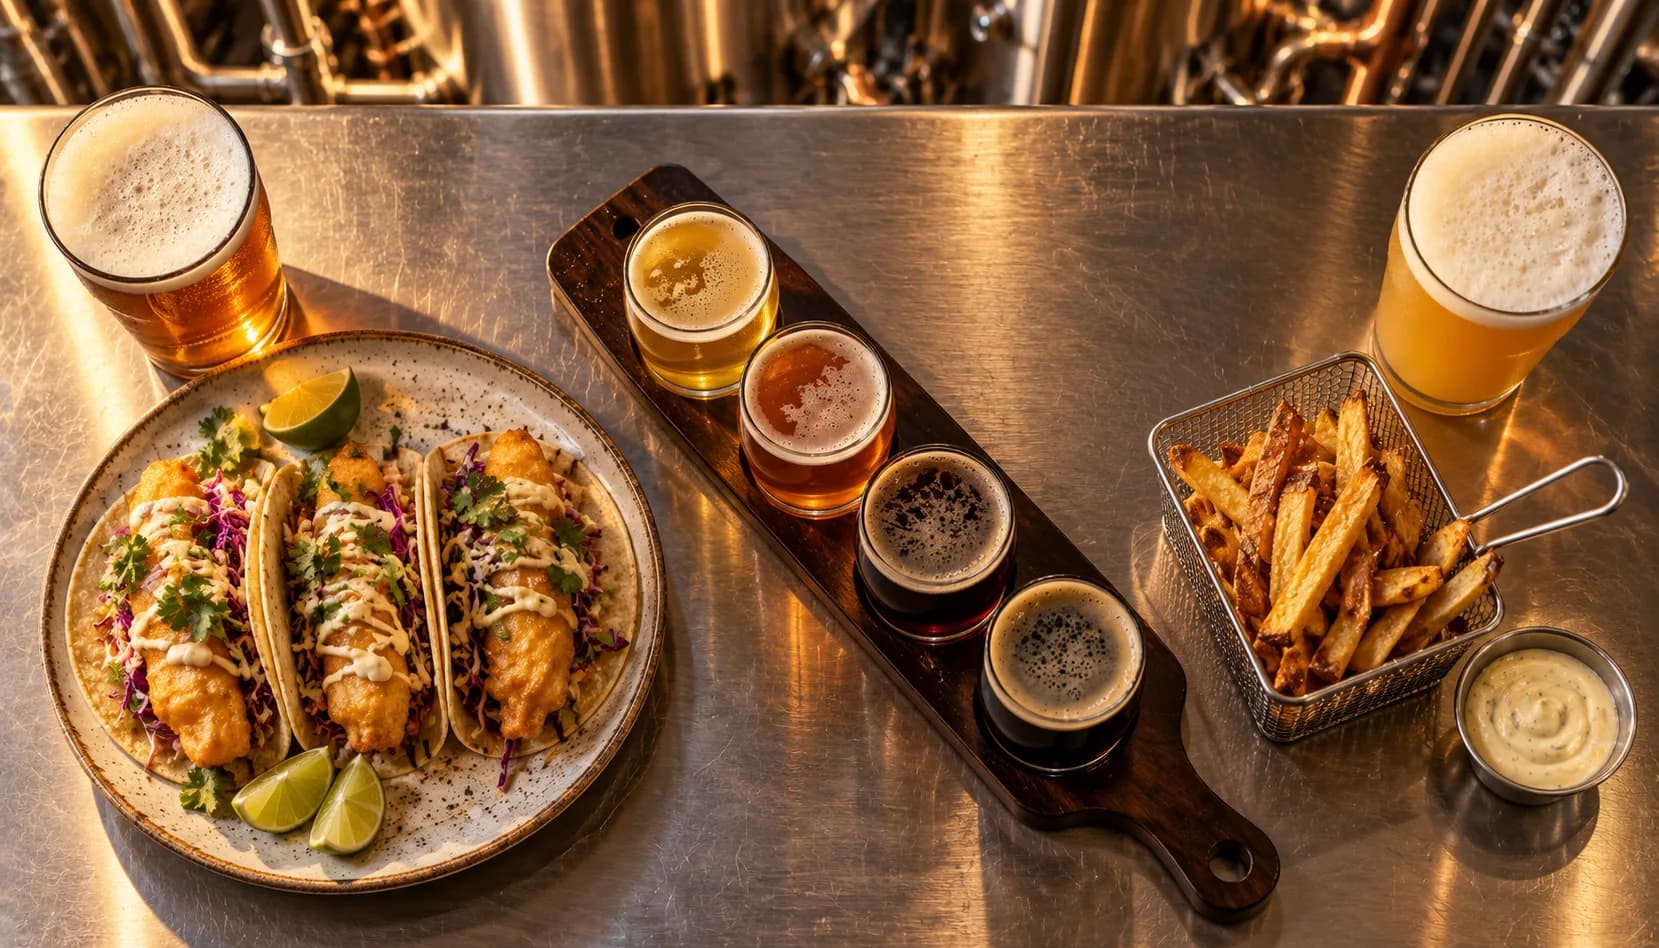
In a brewpub, beer rarely travels alone. The core question is: is the beer driving visits, or riding along with dinner?
- Food attach rate. The share of beer tickets that also include food. It tells you how much of the room is drinking guests versus dining guests.
- Beer's share of the check. If it is shrinking, your guests are treating the brewpub as a restaurant that happens to brew.
- Beer-and-food pairings. Which beers sell next to which dishes. The guest who orders the Hazy IPA with the smashburger every Tuesday is a different customer from the one who comes in for a flight.
- Daypart mix. Lunch, happy hour and dinner often draw different crowds with different taste.
The metric that misleads: beer volume on its own. A busy kitchen night lifts it whether or not anyone came for the beer.
Taproom-only breweries: the regular is the business
A taproom-only brewery has no kitchen and no distribution to cushion a weak month. Its core question is: are first-timers becoming regulars?
- Second-visit rate. The share of first-time customers who come back within 30, 60 or 90 days. The most honest health metric a taproom can track.
- Visit cadence by cohort. Are the people who joined in spring still coming in as often as they did in summer?
- At-risk regulars. Guests who used to come weekly and have gone quiet. They are usually the cheapest win-back you will ever run.
- Style mix by customer. Who drinks what, by name. You need that for anything beyond a blast email.
The metric that misleads: total transactions. Fifty new faces on a festival weekend can hide twenty regulars drifting away.
Production breweries: the taproom is the test market
For a production brewery, most of the beer is sold through a distributor and drunk somewhere you never see. The taproom is the one room where you meet the drinker. Its core question is: what should we scale?
- Repeat orders on pilot batches. How many of the same customers order a pilot beer again. First pours mostly measure curiosity.
- Taste segments. How many of your taproom guests sit in each flavor camp: hop-forward, crisp-and-clean, roasty, sour.
- Release response. How quickly the taproom regulars who like a style show up when a new one pours.
- Taproom share of volume. From your own production records. It tells you how much weight to put on the taproom signal.
The metric that misleads: release-day sales. A line out the door on a can release measures your marketing. It can't tell you whether people will reorder the beer in March.
The three side by side
| Brewpub | Taproom-only | Production | |
|---|---|---|---|
| Core question | Is beer driving visits? | Are first-timers becoming regulars? | What should we scale? |
| Pin to the top | Food attach rate, beer share of check, pairings | Second-visit rate, visit cadence, at-risk regulars | Repeat orders on pilots, taste segments, release response |
| Misleading on its own | Beer volume | Total transactions | Release-day sales |
| Where the data lives | Kitchen and bar POS | Taproom POS | Taproom POS plus production and distributor reports |
Example Brewery Scenario
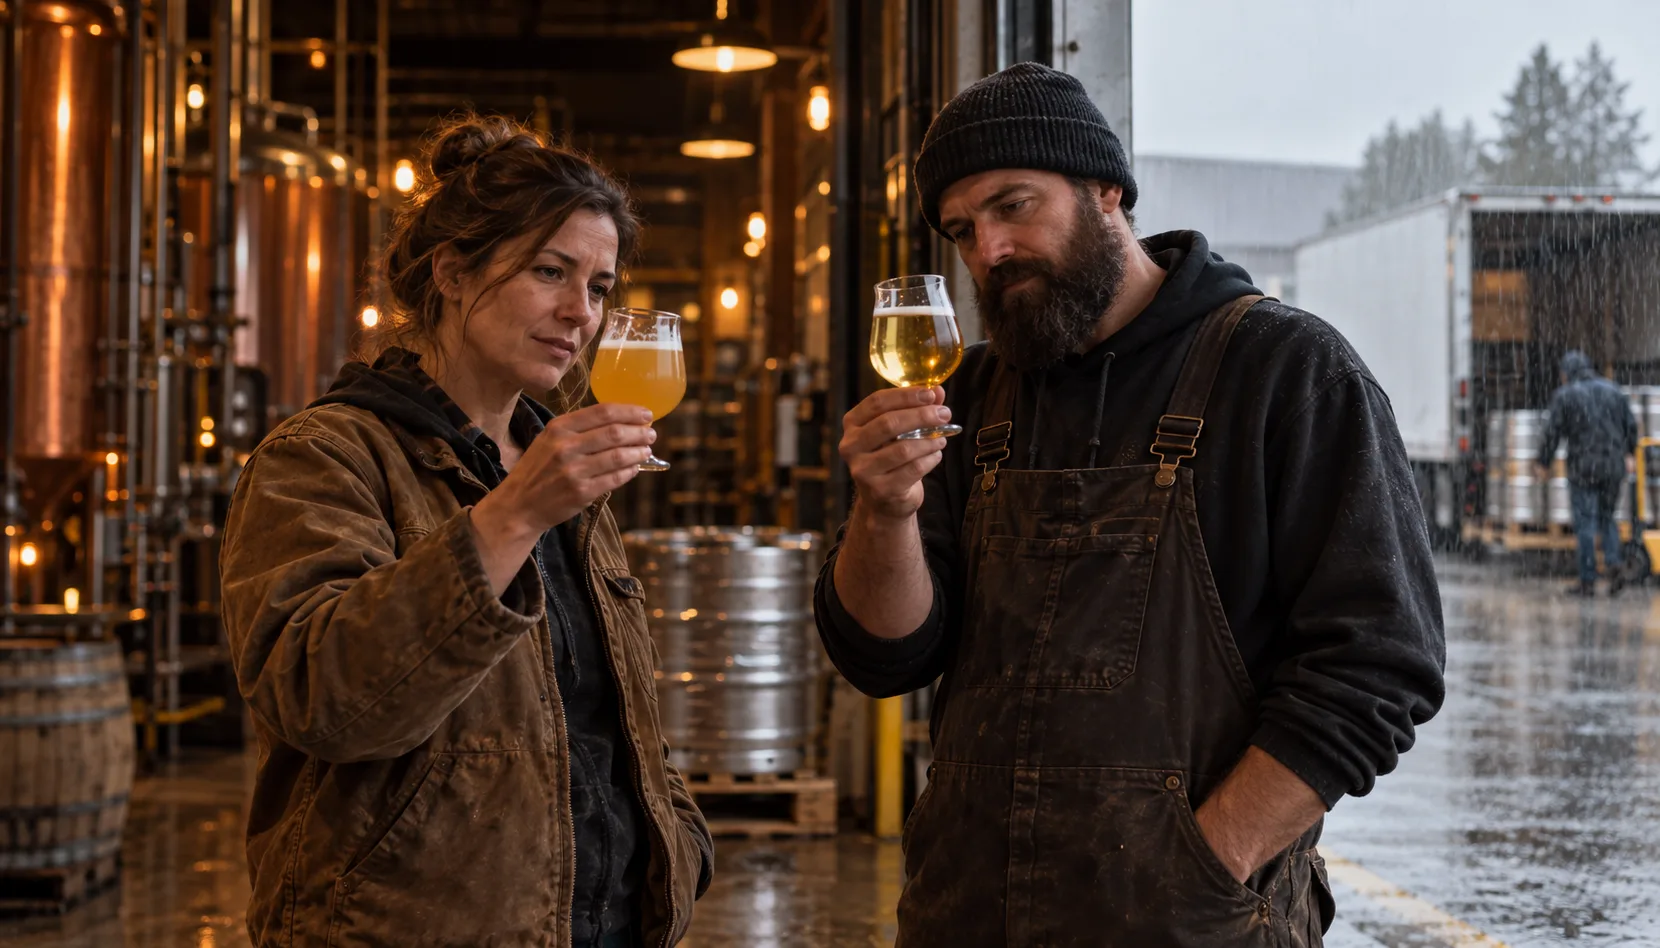
Take a fictional production brewery, Ironline Brewing: a 15-barrel brewhouse that sells about three-quarters of its volume through a regional distributor. The taproom runs on Square and is open four days a week.
For two years, Ironline's owner read one taproom number every Monday: weekly revenue. It went up on release weekends and down in January, and it never told her anything she didn't already know.
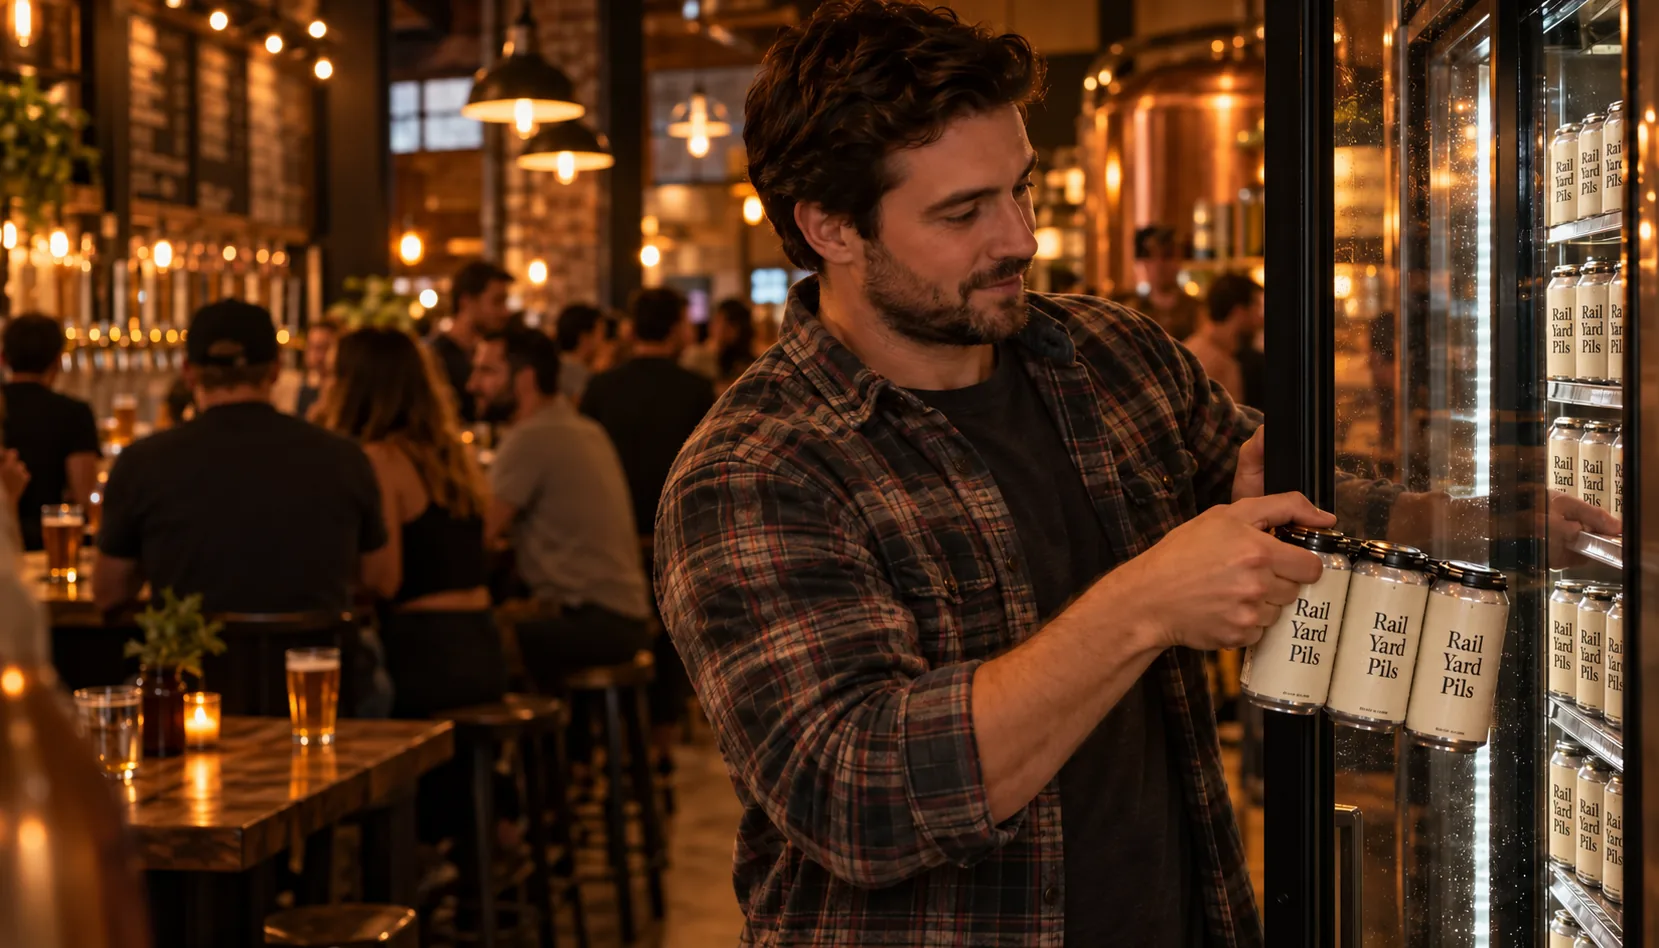
This summer the brewery ran two pilot batches in the taproom: Signal Fire, a hazy IPA, and Rail Yard Pils, a Czech-style pilsner. On release-day numbers, Signal Fire won easily. It sold more than twice as many first pours in its opening weekend, and it got the social posts.
Then she looked at repeat orders. Over six weeks, the pils had fewer first pours but far more customers ordering it a second and third time. Most of those repeat drinkers sat in the crisp-and-clean taste segment, a group the brewery's hop-forward release calendar had mostly ignored.
Ironline put Rail Yard Pils into cans for the fall distribution order. Signal Fire stayed a taproom-only seasonal.
Practical Checklist

Do these this week:
- Name your model in one sentence. Where does most of your money come from: the kitchen, the bar, or distribution? Hybrids are fine, but pick the primary one.
- Write down your core question. Use the table above. One question, not five.
- Pick three metrics that answer it and pin them to the top of whatever you look at on Monday morning.
- Demote one misleading number. Keep it in the report, but stop opening the meeting with it.
- Check your POS can tell customers apart. If sales aren't tied to a phone number or customer record, you can't measure second visits or repeat orders at all.
- If you distribute, get your taproom share of volume from your production records so you know how much weight the taproom signal deserves.
- Set a review date. Look at the same three numbers monthly for a quarter before changing them.
How Brewlytics Helps
Brewlytics works on the customer side of the business, which is the part all three models share. It does not track distribution or wholesale invoicing; that stays in your production software and distributor reports.
- POS Sync reads Square today and backfills 12 months of history on connect, so second-visit rate and visit cadence start from real data instead of zero. A Toast integration, the better fit for brewpubs with a kitchen because it will read food and beer items together, is planned but not live yet.
- Customer Taste Profiles fill in as guests rate beers, claim orders and chat with Barley, so a production brewery can see which camp its pilot-beer repeat drinkers sit in.
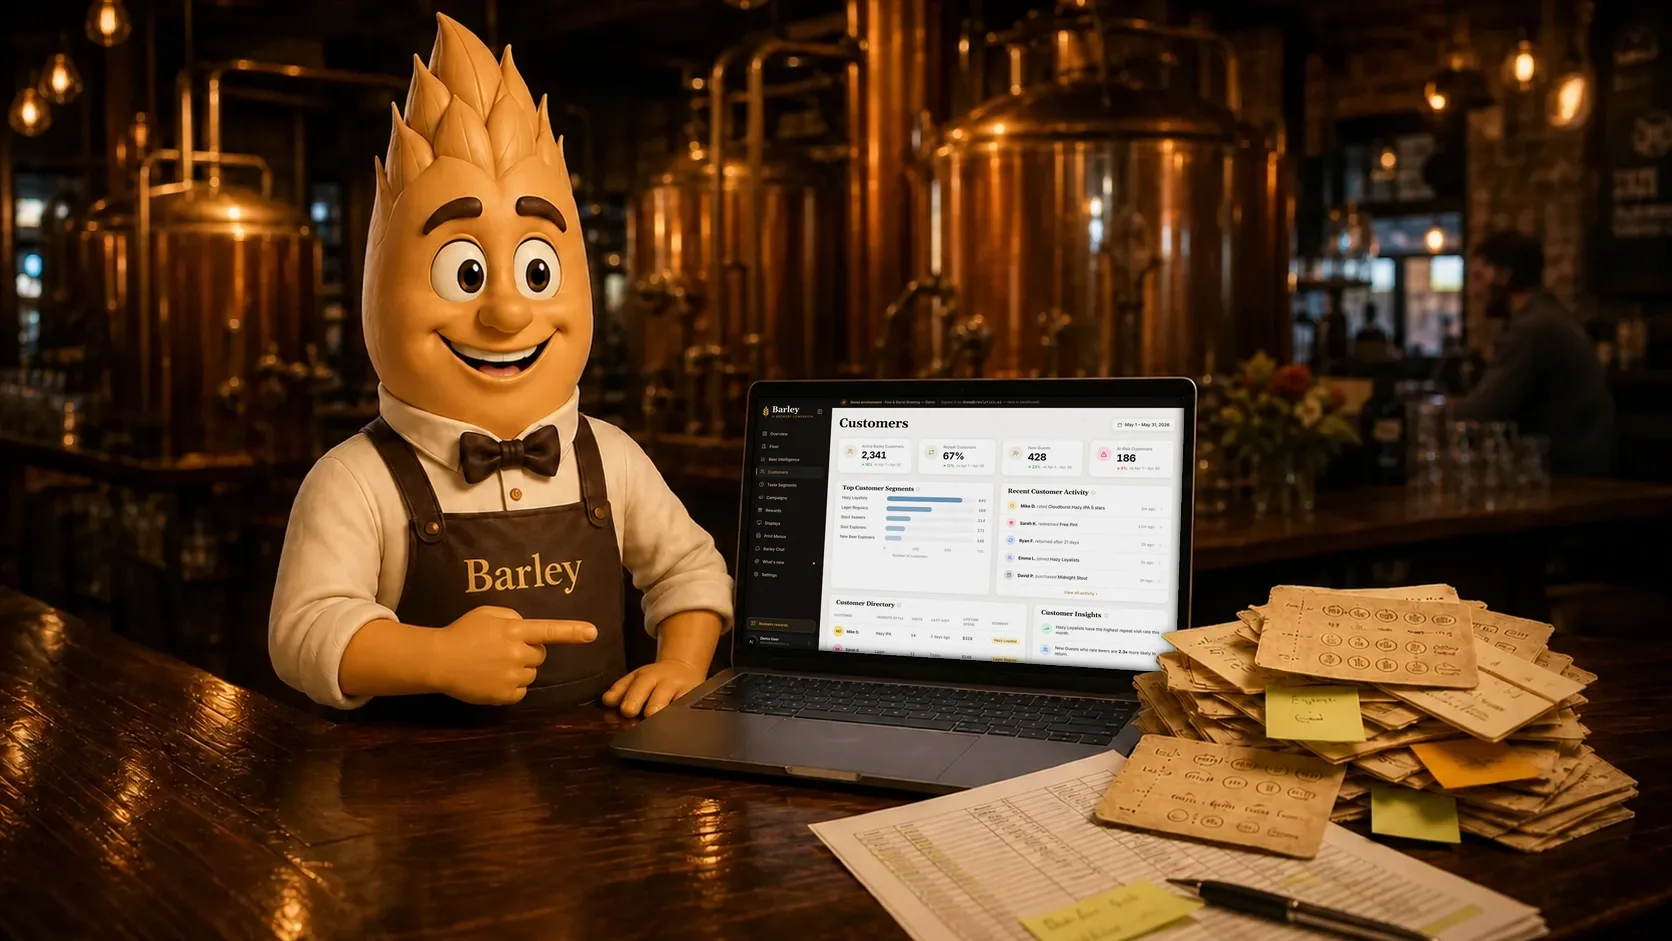
- Taste Segments like Hazy IPA fans, crisp-and-clean drinkers, first-timers and at-risk regulars are ready out of the box, and you can compose your own by style, recency and spend. See customer insights.
- Repeat-visit and SKU reporting shows which beers drive return visits, not just one-time pours, which is the number Ironline needed.
For how this data feeds your marketing plan, see the brewery marketing complete guide. If you're still choosing a POS, the Square vs. Toast vs. Arryved comparison walks through the trade-offs by business model.
FAQ
See the schema-ready FAQ block at the end of the page for the full set.
Ready to see what your taproom data already says?
Whatever your model, the customer data in your POS answers more questions than a weekly revenue number. Book a walkthrough and we'll connect your Square account and show you your second-visit rate and taste segments, or see how Brewlytics works for breweries.
Frequently asked questions
Related Brewlytics Feature
Taste Segments
Auto-built segments based on what customers actually drink.
See how it works →Keep reading
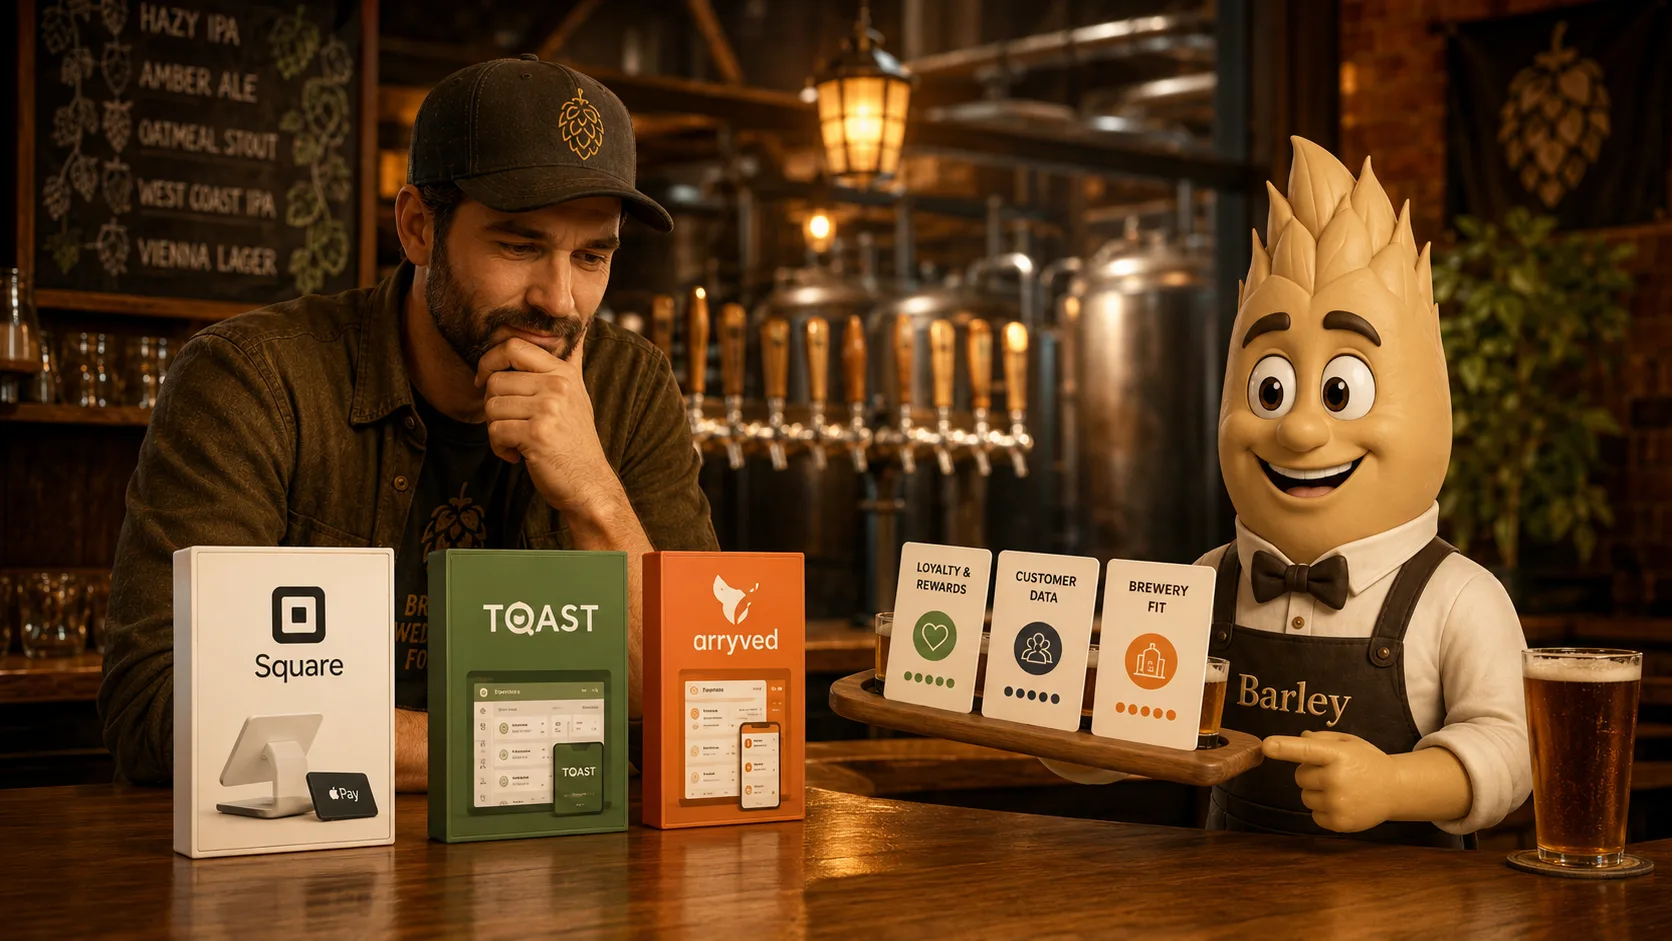
Square vs. Toast vs. Arryved for Brewery Loyalty and Customer Data
Square, Toast, or Arryved for your brewery? Compare native loyalty depth and how easily your customer data comes back out of each POS.
Untappd Insights vs Brewlytics: Market Data or Your Own Guests?
Untappd Insights sells category-level market intelligence from the Untappd network. Brewlytics builds per-guest taste and spend profiles from your own POS.
Best Brewery CRM Software (2026)
Nine brewery CRM tools compared for 2026 — Untappd, Bloom, AnyRoad, CraftPeak, Arryved, HubSpot, Sequenzy and Brewlytics — with verified pricing and the gaps.
Want to see this working in your brewery?
Go Pro to see your customers and act on the data — taste profiles, segmented iMessage, SMS + email campaigns, the AI bartender, and the full dashboard. Or book a walkthrough with the brewer who built it. Not ready? Start free, no card.
Just here for the beer? Get the free Barley app