
Should You Cut Taproom Hours? How to Decide With Your Sales Data
By Brian Winckel · Founder, Brewlytics.ai
Short Answer
Cut taproom hours only when your own sales data says a block of time keeps losing money and the people who visit then are likely to come on another day. Pull 12 or more weeks of POS sales by day and hour, compare each block's gross margin to its labor and utility cost, check which customers come in that block, then test the change for a season and see whether the revenue moved to the days you kept open.
Barley's Take
Quiet hours aren't automatically losing hours. Find out who's sitting at the bar on that dead Tuesday before you lock the door on them.
Why This Matters for Breweries
A question that keeps coming up among brewery owners goes something like this: if we cut our taproom hours and squeeze the same business into fewer, busier days, do we keep the sales and save the labor? A farm brewery in a crowded local market asked exactly that recently, along with how other breweries chose which days or seasons to cut.
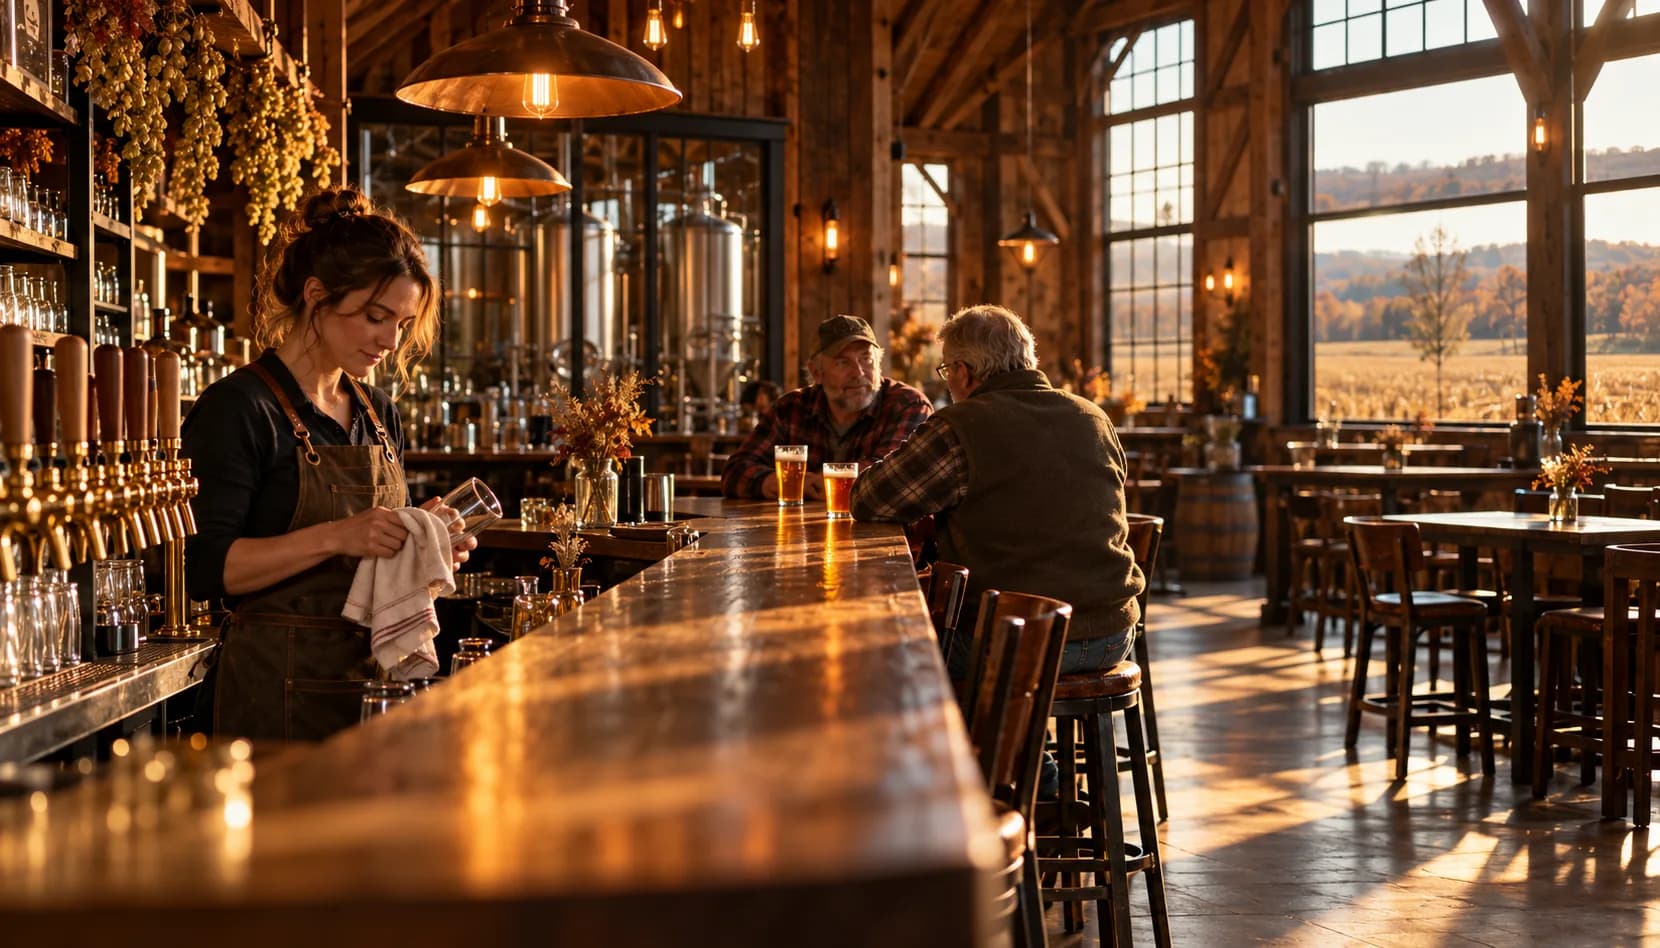
It's a fair question. A taproom open from noon to 9pm, six days a week, pays a bartender for every one of those hours whether the room holds two people or forty. Heat, lights, glycol and the walk-in keep running either way. When a Tuesday afternoon sells a handful of pints of your Pilsner and a growler fill, it's natural to wonder why you're open.
Other breweries' answers won't transfer, because their market, regulars and costs aren't yours. Your own answer is already in your POS, and getting it wrong in either direction costs money: stay open and you keep paying for empty hours, cut the wrong block and you lose regulars who never move to another day.
How It Works
The decision comes down to four questions, asked in order.
1. When does the money actually come in?
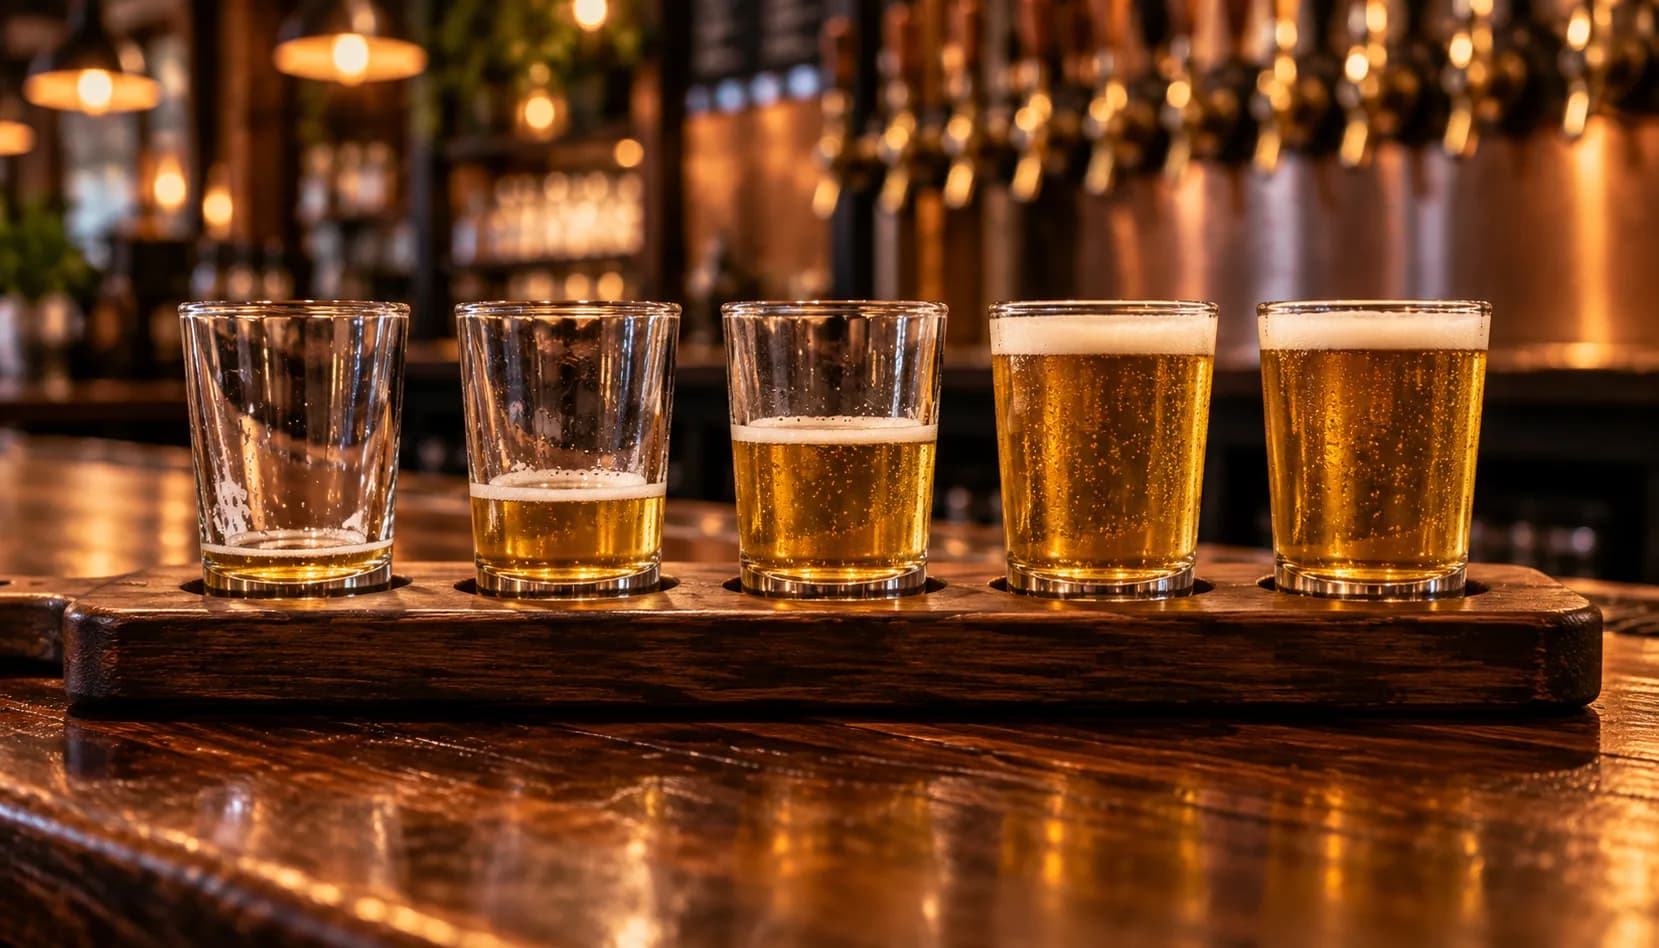
Export at least 12 weeks of sales from your POS by day of week and hour. Most POS systems, Square included, can report sales by hour; a spreadsheet pivot does the rest. Twelve weeks smooths out one bad weekend or a rainy stretch. If your business is seasonal, compare the same months from last year too, because a quiet November afternoon says nothing about July.
Lay it out as a grid: days across the top, hours down the side, average sales in each cell. Most taprooms find the weak spots are specific windows, such as weekday afternoons before 4pm or the last hour on a Sunday, rather than whole days.
2. What does each block cost to keep open?
For every block you're considering, add up what it costs to run:
| Cost | How to estimate it |
|---|---|
| Labor | Staff on the floor × hours × loaded hourly cost (wage plus payroll taxes) |
| Utilities | The share of your monthly power and gas that runs while the taproom is open |
| Product | Cost of goods on what sells in that block |
| Minimums | Anything you can't avoid, like the one person who has to be there to open |
Now compare the block's gross margin (sales minus cost of goods) to its labor and utility cost. A block that misses that line week after week is a candidate. A block that misses it once is just a slow week.
3. Who is sitting at the bar?
This step decides whether cutting works. Revenue only moves to another day if the people who come in that block will come on another day.
Look at the customers who visit in the hours you'd cut. Some are guests who'd happily come Thursday instead. Others are regulars whose whole habit is "Tuesday after work at the brewery." If a big share of the block's revenue comes from people who never visit on any other day, closing it may cost you those people, not just those hours.
4. What else changes?
Cutting hours touches more than the schedule:
- Google hours. People check Google before they drive out, and a "Closed" result sends them somewhere else that day. Update your Google Business Profile the day the change starts.
- Staff hours. Fewer shifts can mean losing a good bartender who needed those hours.
- Habit. Regular visits are habits. Break one and it doesn't always come back when you reopen.
- To-go sales. If people swing by for cans or growler fills, those sales may not show up as "taproom" in your head, but they live in the same hours.
Example Brewery Scenario

Hollow Creek Farm Brewing (a fictional brewery) runs a 10-barrel system on a working farm 20 minutes outside town, pours through Square, and has a taproom open Tuesday to Sunday, noon to 9pm. Its lineup is a Pilsner, an amber lager called Fence Line, a Hazy IPA and a rotating fruited sour. The owner wants to close Tuesdays and Wednesdays.
She pulls 12 weeks of Square sales by hour. The grid shows something different from what she expected: Tuesday and Wednesday from noon to 4pm average a few hundred dollars a day combined, well under the cost of two staff. But Wednesday from 5 to 8pm is busy, because a local run club finishes its route at the brewery every week.
Then she looks at who comes in those slow afternoons. Most of them also visit on a weekend, so their business would probably move. The Wednesday evening crowd is different: most of the run club members rarely visit any other day.
Her decision: open Tuesday and Wednesday at 4pm instead of noon, keep Wednesday evening as is, and run the change from January through March. She updates Google, the website and the door sign, texts her regulars two weeks ahead, and plans to compare the quarter against the same quarter last year. That trims eight open hours a week and leaves her busiest weeknight alone.
Practical Checklist
- Export 12+ weeks of POS sales by day of week and hour, plus the same months last year if seasonal.
- Build the day-by-hour grid and mark every block that looks weak.
- Work out labor, utilities and cost of goods for each marked block.
- Flag the blocks whose gross margin misses their running cost most weeks.
- Check which customers visit in those blocks and whether they also come on other days.
- Try one fix first on the weakest window: a standing event, a partner group, a shorter after-work menu.
- If you cut, decide the test length now (one season) and what "worked" means.
- Update Google Business Profile, website, socials and door signage the day it starts.
- Tell regulars directly, and brief staff on what to say when people ask.
- At the end of the test, compare total weekly revenue and regular visit frequency to the same period before.
If you try fixing the window first, the weeknights section of our slow-taproom playbook and these brewery event ideas that drive revenue are good starting points. Both connect to the bigger picture in the complete guide to brewery marketing.
How Brewlytics Helps
Brewlytics connects to your POS and turns transactions into customer data, which is what the third question above needs.
- POS sync with history. Connect Square and Brewlytics backfills 12 months of transaction history, so your first look at a block of hours includes last season, not just last week.
- Segments by time of day. In Customer Insights you can build a segment from time of day, recency and spend tier and see who actually visits in the hours you're thinking about cutting.
- At-risk regulars. If a schedule change breaks someone's habit, Brewlytics flags regulars who used to come often and stopped, so you can reach them before they drift for good.
- Campaigns with attribution. Text the right people about new hours or a new weeknight event, then see the visits and revenue each send brought in.
FAQ
See the schema-ready FAQ block at the end of the page for the full set.
Ready to See Who Fills Your Slow Hours?
Before you change the hours on the door, find out who's coming in during them. Book a demo and we'll show you your own customers by day and time, or see how Brewlytics works for breweries.
Frequently asked questions
Related Brewlytics Feature
POS Sync
Continuous sync between your POS and the Brewlytics customer graph.
See how it works →Keep reading
How Brewpubs, Taprooms, and Production Breweries Need Different Data
Brewpubs, taproom-only breweries and production breweries ask different questions of their data. Here are the metrics that matter for each.
Untappd Insights vs Brewlytics: Market Data or Your Own Guests?
Untappd Insights sells category-level market intelligence from the Untappd network. Brewlytics builds per-guest taste and spend profiles from your own POS.
Best Brewery CRM Software (2026)
Nine brewery CRM tools compared for 2026 — Untappd, Bloom, AnyRoad, CraftPeak, Arryved, HubSpot, Sequenzy and Brewlytics — with verified pricing and the gaps.
Want to see this working in your brewery?
Go Pro to see your customers and act on the data — taste profiles, segmented iMessage, SMS + email campaigns, the AI bartender, and the full dashboard. Or book a walkthrough with the brewer who built it. Not ready? Start free, no card.
Just here for the beer? Get the free Barley app